Data science with R
Using the tidyverse and Quarto
UniLu
Thursday, the 27th of June, 2024
First slide
{.incremental}fenced div 👍from: markdown+emojiin header allows emoji usage 😄- Chunk options are
hashpipe, completion works great 👋 - Great trick in RStudio:
CTRL+,✔️
Click logo
Following discussion on quarto-cli, logo on each slide can point to the desired URL.
Set it in the YAML header with logo_url: "https://fasterthanli.me"
If not set, it points to https://quarto.org
Practical
Using {background="#e4f0ff"} class to the header2
Absolute positioning of image and text, increment with . . .

Console
Columns as fenced divs {.columns} and LaTex
Trying to get rid of xaringanExtra1
contents… 40%
\[\begin{gather*} a_1=b_1+c_1\\ a_2=b_2+c_2-d_2+e_2 \end{gather*}\]Playing with {.fragment} transitions
Highlight red
Fade in
Slide up while fading in
YAML
::: {.panel-tabset}
---
format: test
---
Layout for images

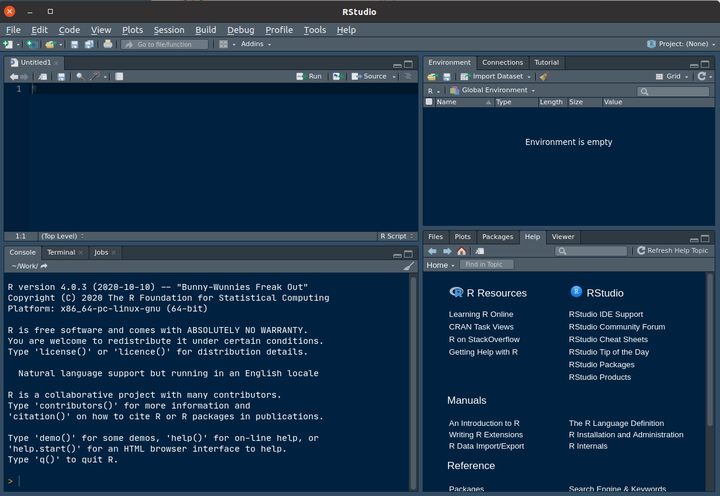
dplyr via RStudio
Two ways of installing packages
.r-fit-text class
Big Text
More in the official Quarto Presentation demo and available code
Blockquote
Literate programming is the practice of mixing code and descriptive writing in order to execute and explain a data analysis simultaneously in the same document.
— William Landau
Source: {targets} user manual
Layout for chunks too
- Highlight code lines, incremental with
| - Execute code inside a caption with
!expr
```{r}
#| layout-ncol: 2
#| code-line-numbers: "|3-4,6|7"
#| fig-cap: !expr glue::glue("Swiss data are {nrow(swiss)} rows")
#| fig-height: 3
plot(swiss$Agriculture, swiss$Fertility)
plot(swiss$Agriculture, swiss$Education)
```

