# A tibble: 4,033 × 4
   Time                `Carbon dioxide(ppm)` `Temperature(°C)`
   <dttm>                              <dbl>             <dbl>
 1 2022-07-31 22:53:43                   457              24
 2 2022-07-31 22:58:43                   444              24.1
 3 2022-07-31 23:03:43                   457              24
 4 2022-07-31 23:08:43                   444              24
 5 2022-07-31 23:13:43                   445              24
 6 2022-07-31 23:18:43                   454              24.1
 7 2022-07-31 23:23:43                   432              24.1
 8 2022-07-31 23:28:43                   442              24.1
 9 2022-07-31 23:33:43                   469              24
10 2022-07-31 23:38:43                   455              24
# ℹ 4,023 more rows
# ℹ 1 more variable: `Relative humidity(%)` <dbl>The question is: how can we plot one variable for faceting vertically?
And bonus, since we want through time the plot of very different measurements, we must have a free y-scale.
TL;DR
Use either:
- The
dir = "v"argument offacet_wrap() - The
rows = vars(variable)argument offacet_grid()
Demo
We will use a file from the Aranet4 sensor using the mobile app provided by the company. This sensor measures 4 parameters every 2 to 10 minutes which are:
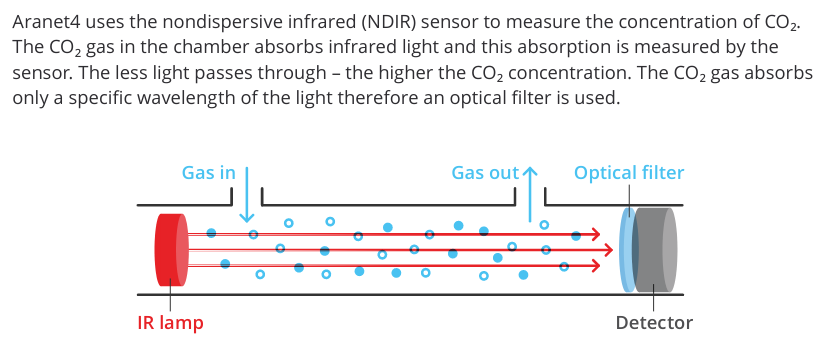
CO2, using the infrared absorption property of greenhouse gases like carbon dioxide.
Temperature in Celsius degrees.
Relative humidity (in %).
Atmospheric pressure in _h Pa_. This latter variable is exported but displayed on the device, we will skip it.
The CO2 measurement is performed as follows (from the user manual):
According to the file extension, it is a comma-separated values. But if you look at the file with a text editor, you will see that values are surrounded by double quotes and number are using commas for decimal separator. Moreover, the dates are not in a standard format unfortunately. But it is a real life example data.
readr will detect the double quotes and deal with it automatically but the other issues needs to be fixed:
- For the
Time(dd/mm/yyyy)column, the datetime format is specified. - For the number decimals as commas, you need to set the locale to
locale(decimal_mark = ",") - Skip the last column (Atmospheric Pressure) as we won’t plot it.
Reshape the variables in the long format
# A tibble: 12,099 × 3
Time measure value
<dttm> <chr> <dbl>
1 2022-07-31 22:53:43 Carbon dioxide(ppm) 457
2 2022-07-31 22:53:43 Temperature(°C) 24
3 2022-07-31 22:53:43 Relative humidity(%) 49
4 2022-07-31 22:58:43 Carbon dioxide(ppm) 444
5 2022-07-31 22:58:43 Temperature(°C) 24.1
6 2022-07-31 22:58:43 Relative humidity(%) 49
7 2022-07-31 23:03:43 Carbon dioxide(ppm) 457
8 2022-07-31 23:03:43 Temperature(°C) 24
9 2022-07-31 23:03:43 Relative humidity(%) 49
10 2022-07-31 23:08:43 Carbon dioxide(ppm) 444
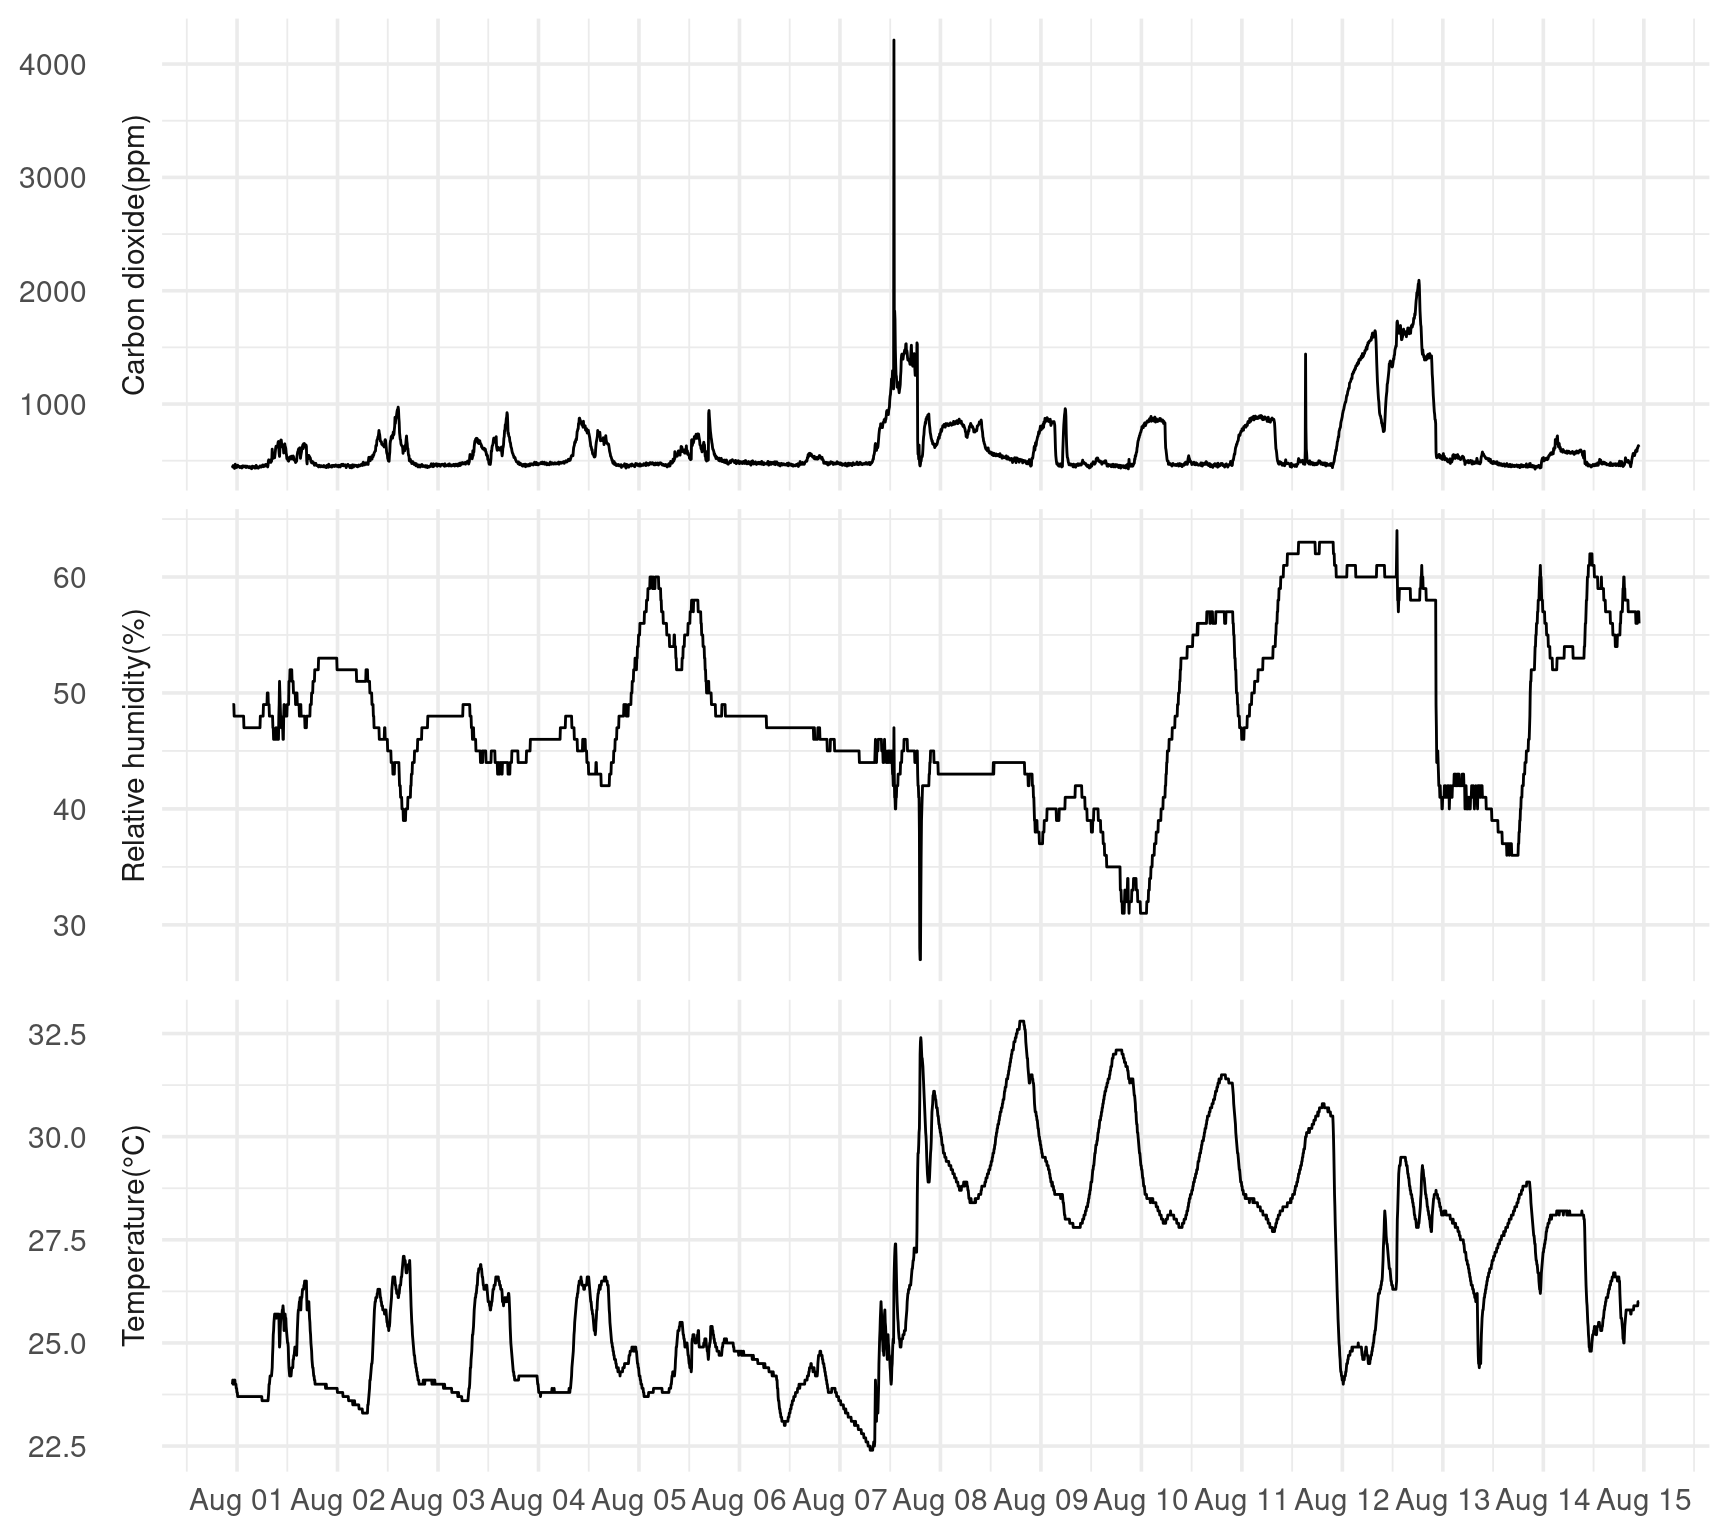
# ℹ 12,089 more rowsPlot the values per Time and facet per measurement
Measurement are one of the 3 variables: CO2 ppm, Temp and Relative Humidity.
In the facet command, you should free the y-axis with scales = "free_y"
We want variables in rows. Either facet_wrap() dir argument or facet_grid() rows = do the job.
facet_wrap() solution
The key part is to change the dir argument for vertical
ggplot(aranet_long, aes(x = Time, y = value)) +
  geom_line() +
  facet_wrap(vars(measure), scales = "free_y",
             # panel titles next to the y axis
             strip.position = "bottom", # use left for mimicking facet_grid below
             dir = "v") +
  scale_x_datetime(breaks = scales::date_breaks("1 day"),
                   date_labels = "%b %d") +
  labs(x = NULL, y = NULL) +
  theme_minimal(14)
facet_grid() solution
faacet_grid() is designed for two variables faceting, but we can omit one.
The key part is to use only the `rows`` argument for vertical panels.